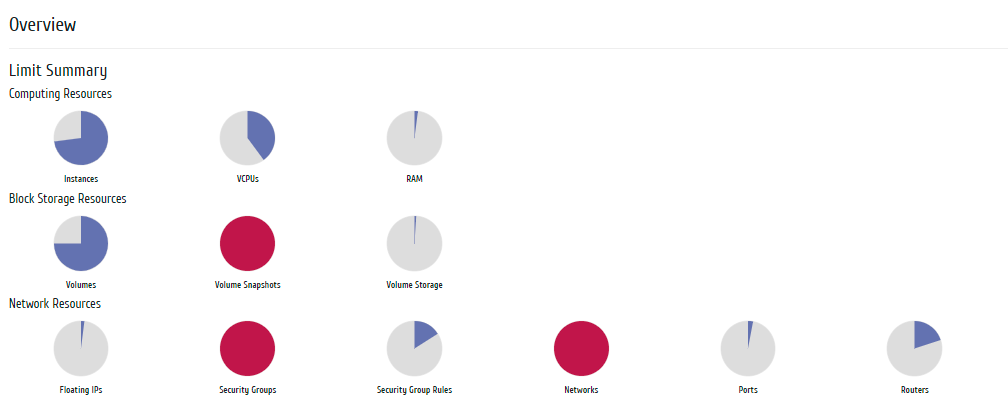
«Overview» tab
Tab consists of two internal tabs “Overview” and “Usage”.
“Overview” tab clearly displays an indicator of the amount of resources used within the framework of this project. The data is presented in pie charts that change color as critical resource utilization is reached. Blue is normal use of resources, orange is approaching the critical level of use, red is critical level, it is impossible to exceed the current use:

Limit summary
| Field name | Description |
|---|---|
| Instances | Number of created instances and their limit. |
| VCPu | Number of used virtual processors and their limit value. |
| ОЗУ | Amount of used RAM and its limit. |
| Volumes | Number of volumes created and their limit. |
| Volume Snapshots | Number of created snapshots and their limit. |
| Volume Storage | Memory resources used. |
| Floating IPs | Number of allocated IP addresses and their limit. |
| Security Groups | Number of created security groups and their limit. |
| Security Group Rules | Number of created security group rules and their limit. |
| Networks | Number of created networks and their limit. |
| Ports | Number of created ports and their limit. |
| Routers | Number of created routers and their limit. |
«Usage» tab displays statistics on the use of resources by instances.

Resource usage statistics
Data is displayed at the time of authorization in the graphical interface, to view information for the previous period of time, use the selection of the required date. In addition, you can get text document with a report on resource usage in CSV format.
| Field name | Description |
|---|---|
| Instance name | Name of the instance, assigned at creation. It is also a link to go to detailed information about a specific instance. |
| VCPUs | Number of used virtual processors. |
| Disk | Memory resources used. |
| RAM | The amount of used RAM. |
| Age | Elapsed time since the instance was created. |
A sort tool is available for all displayed fields. The fields are sorted in ascending and descending order.
Instance name in the list is a link to the page with details.