«Monitoring» tab
It allows to manage settings for monitoring and backing up instances of the current project.
Tab displays all instances of the current project available to the user and provides ability to configure monitoring and backup for them.
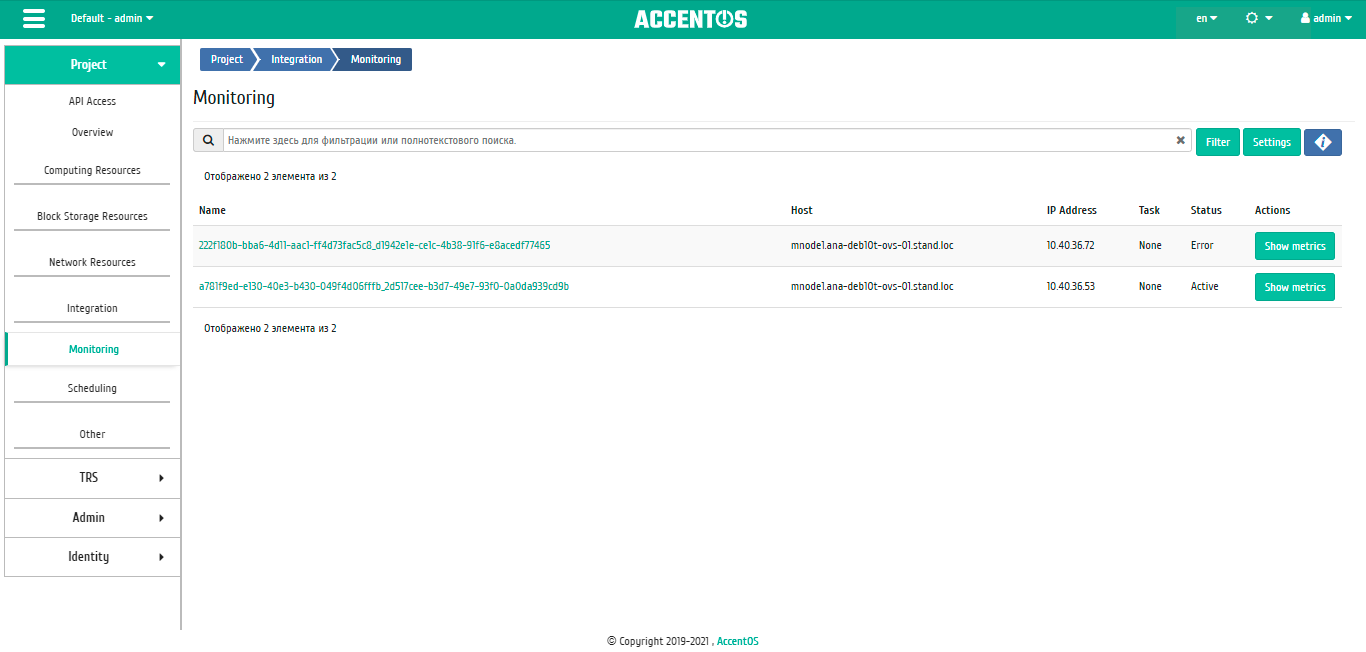
Instances list
| Field name | Description |
|---|---|
| Name | Instance name. |
| Host | Host name of the instance. |
| IP address | IP address of the instance. |
| Task | Displaying progress of the task set for the instance. The task can be set both by the system and by the user. For example, migration, evacuation, shutdown, etc. |
| Status | State of the instance as determined by Openstack services. |
Sorting and filtering tools are available for the list of instances. Fields are sorted in ascending and descending order. It is also possible to sort objects marked with check mark. Filtration is performed according to the following parameters:
- Project is the name of the project of the instance. Incomplete input is allowed;
- Name is the name of the instance. Incomplete input is allowed;
- Host is the name of the instance’s host. Only exact input is allowed;
- Host title is title of the instance’s host. Incomplete input is allowed;
- Type is instance type. Incomplete input is allowed;
- IPv4 address is IPv4 address of the instance. Only exact input is allowed;
- IPv6 address is IPv6 address of the instance. Only exact input is allowed;
- Task is name of the task of the instance. Incomplete input is allowed;
- Status is the state of the instance. Only exact input is allowed;
- Power is the power status of the instance. Incomplete input is allowed.
| N | Action | Description |
|---|---|---|
| 1 | Settings | Manage the set of metrics collected for display. Settings define a set of metrics for the list of instances as a whole. |
| 2 | Manage templates | Management of monitoring system Zabbix templates and backup systems Bareos templates. |
| 3 | Show metrics | Viewing instance work statistics. |
Listed actions are available for execution with respect to one selected instance by selecting the desired action in the “Actions” field of the corresponding line in the list of instances:

Individual actions
Features of work
Manage templates
Important
Managing templates is possible only with appropriate domain settings. You can learn more about configuring backup for a domain in the section “Identity”/”Domains”/”Set up backup”. Action is also available for group of instances, but only within one project.
Function is available in the general list of all instances. It allows to manage the templates of the monitoring system Zabbix and the backup system Bareos. On the “Zabbix templates” tab, the required set of monitoring templates is configured Zabbix, after saving, monitoring will be performed according to selected templates:
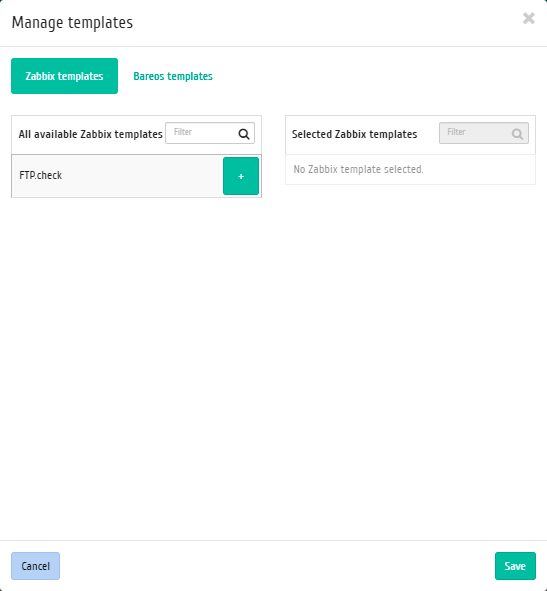
Manage templates window
Important
Zabbix templates are available if monitoring was previously configured for instance project. You can configure monitoring in the tab “Identity”/”Projects” using the function “Set ap monitoring”.
On the “Bareos Templates” tab, the required set of backup templates is configured Bareos, after saving the instance will be backed up according to selected templates:

Manage templates window
Complete the procedure with “Save” button.
Viewing statistics
Function is available in the general list of all instances. After calling the action in the window that opens, graphical data for monitoring the operation of the instance are displayed:
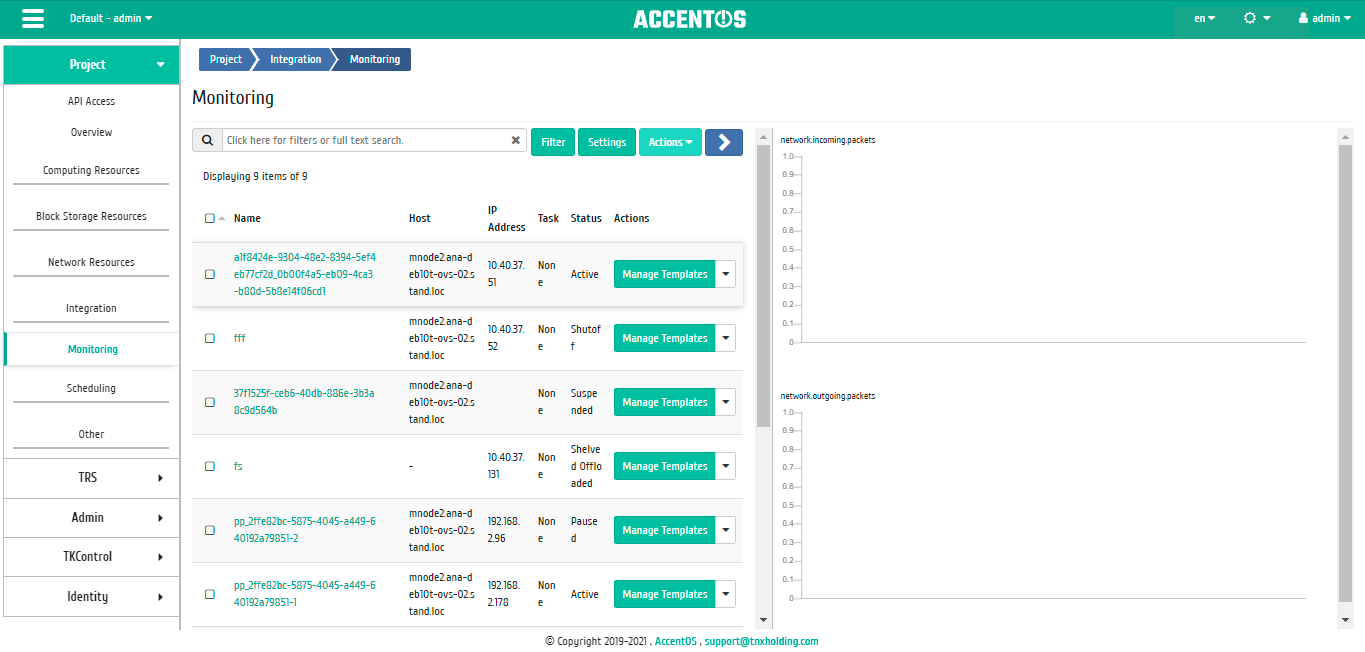
Displaying instance performance statistics
Each of the graphs is clickable, so you can expand and view each of parameters of instance:
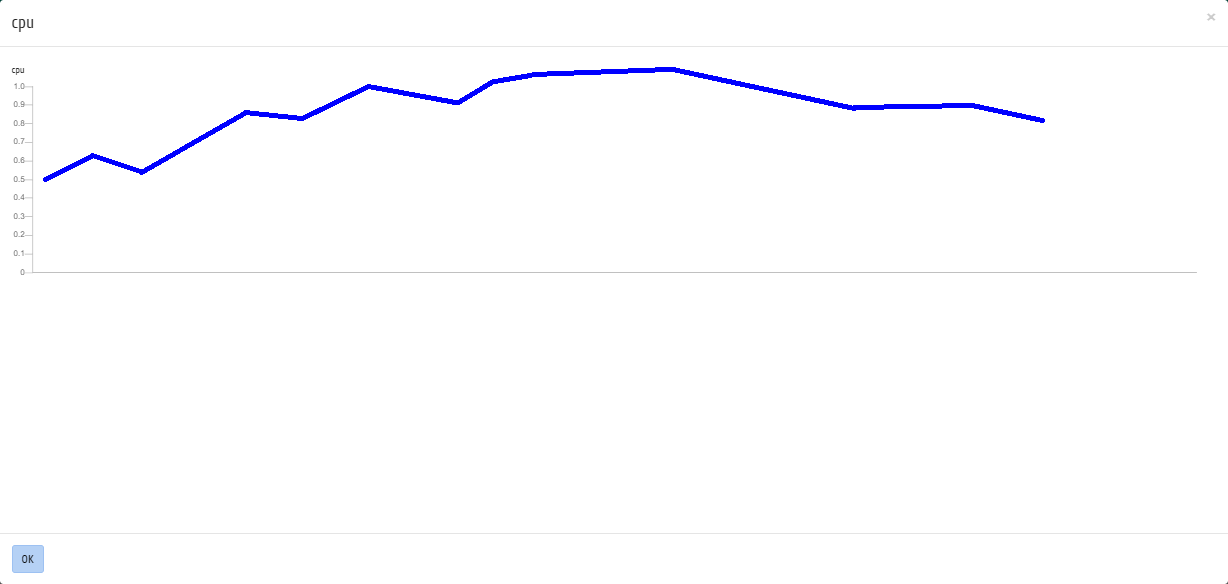
CPU usage graph
To return to the list of instances, use the “Ok” button.
By default, metrics are collected only for:
- percentage of CPU utilization;
- percentage of RAM usage.
It is possible to customize the output and other metrics. Go to the “Integration”/”Monitoring” tab and use the “Settings” function.
Note
Monitoring is displayed only if there is data for visualization.
Managing set of metrics
Note
Setting is carried out only within one user.
Function is available in the general list of all instances. It allows to manage all available metrics:
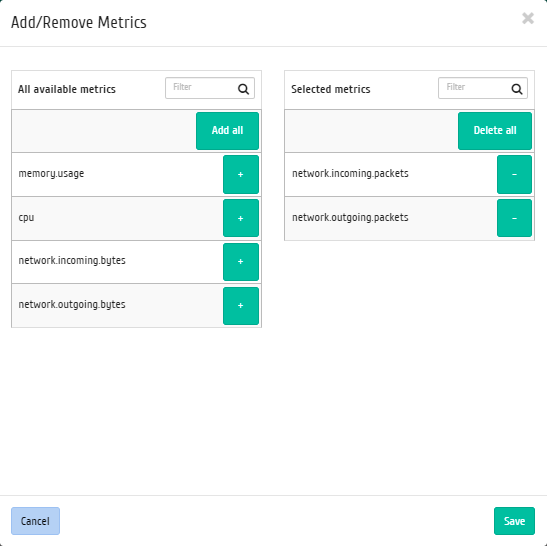
Managing of metrics window
In the window that opens, configure the set of metrics you need. After saving, statistics for instances will be displayed only for the selected metrics.
Managing instance group templates
Function is available on the top panel in the general list of all instances. Select the required ones and call the action “Manage templates”. On the “Zabbix templates” tab, the required set of monitoring templates is configured Zabbix, after saving, monitoring for instances will be performed only according to the selected templates:

Managing instance group templates
Important
Zabbix templates are available if monitoring was previously configured for instance project. You can set up monitoring in the tab “Identification”/”Projects”, using the function “Setting up monitoring”.
On the “Bareos Templates” tab, the required set of backup templates is configured Bareos, after saving the instances will be backed up according to the selected templates:
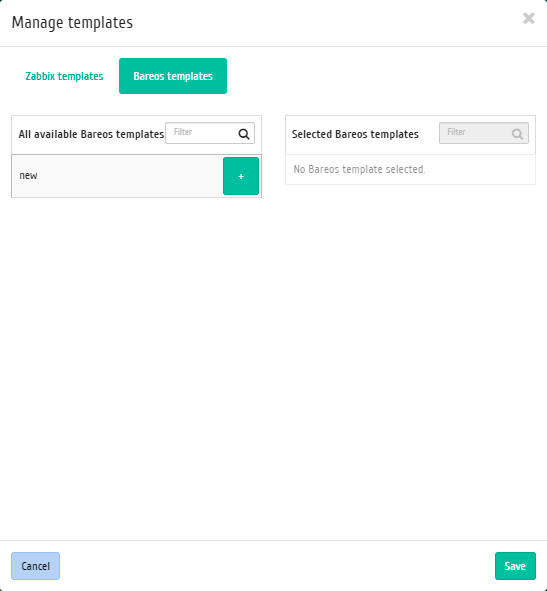
Template management window
Complete the procedure with “Save” button.