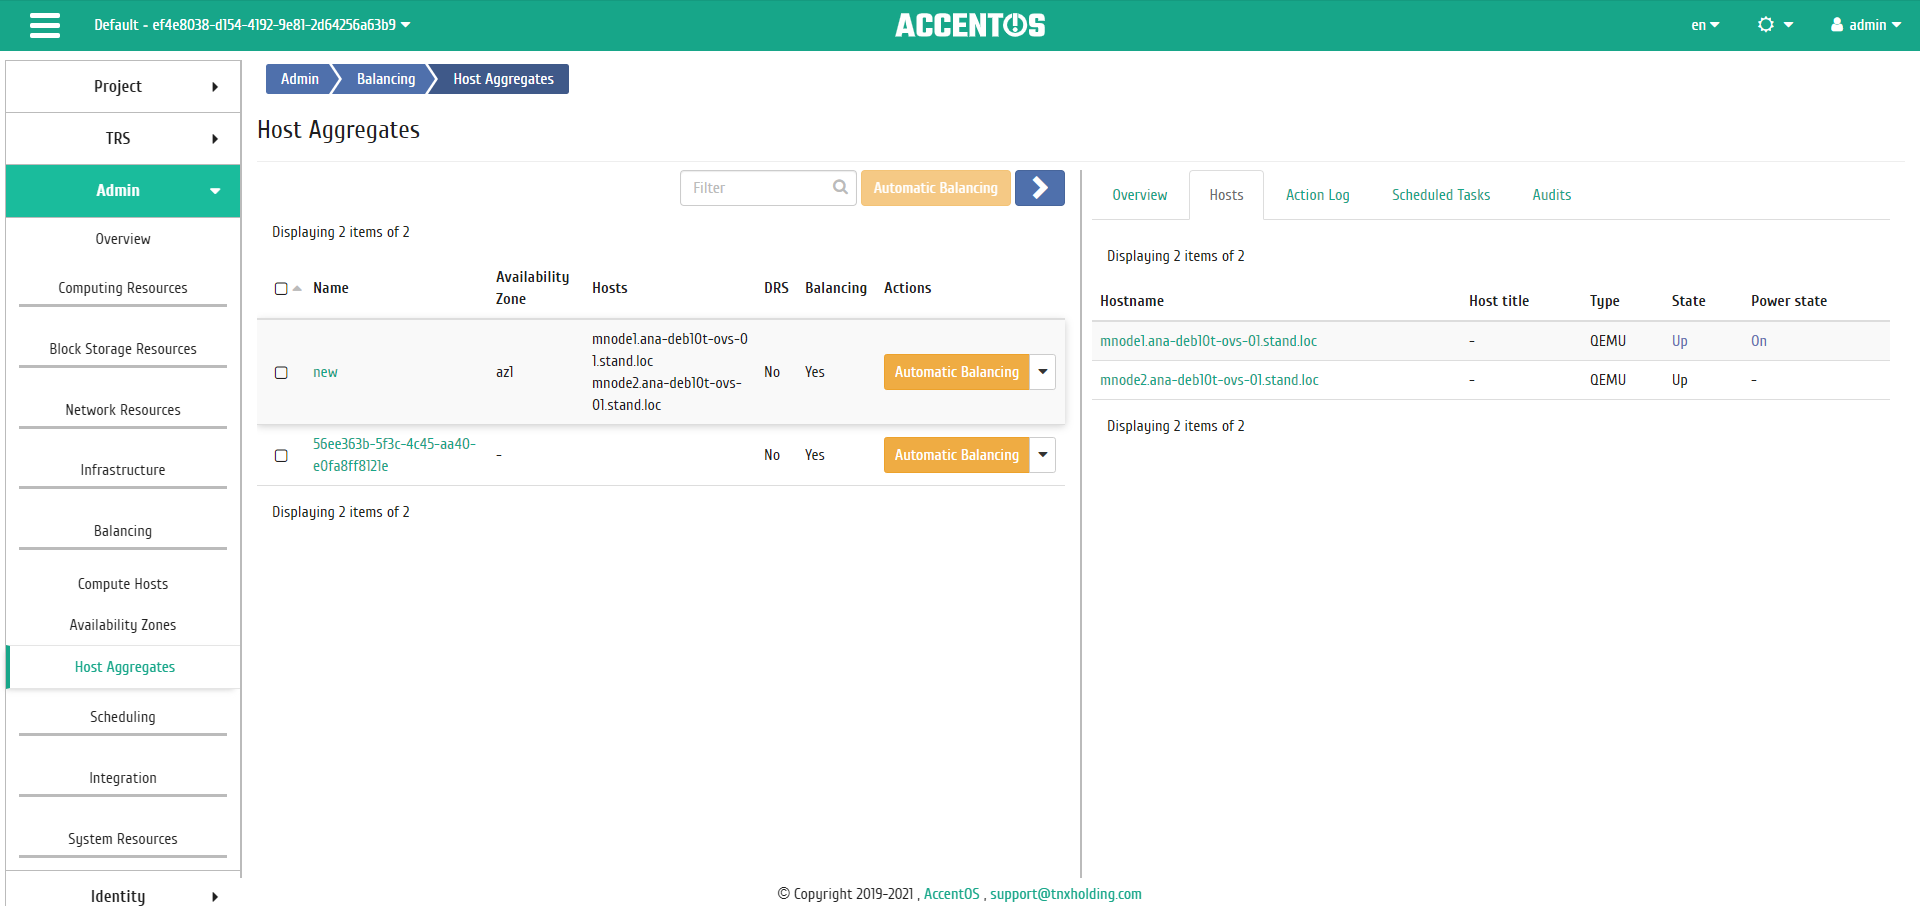
«Host aggregates» tab
It displays list of host aggregates and their availability zones.
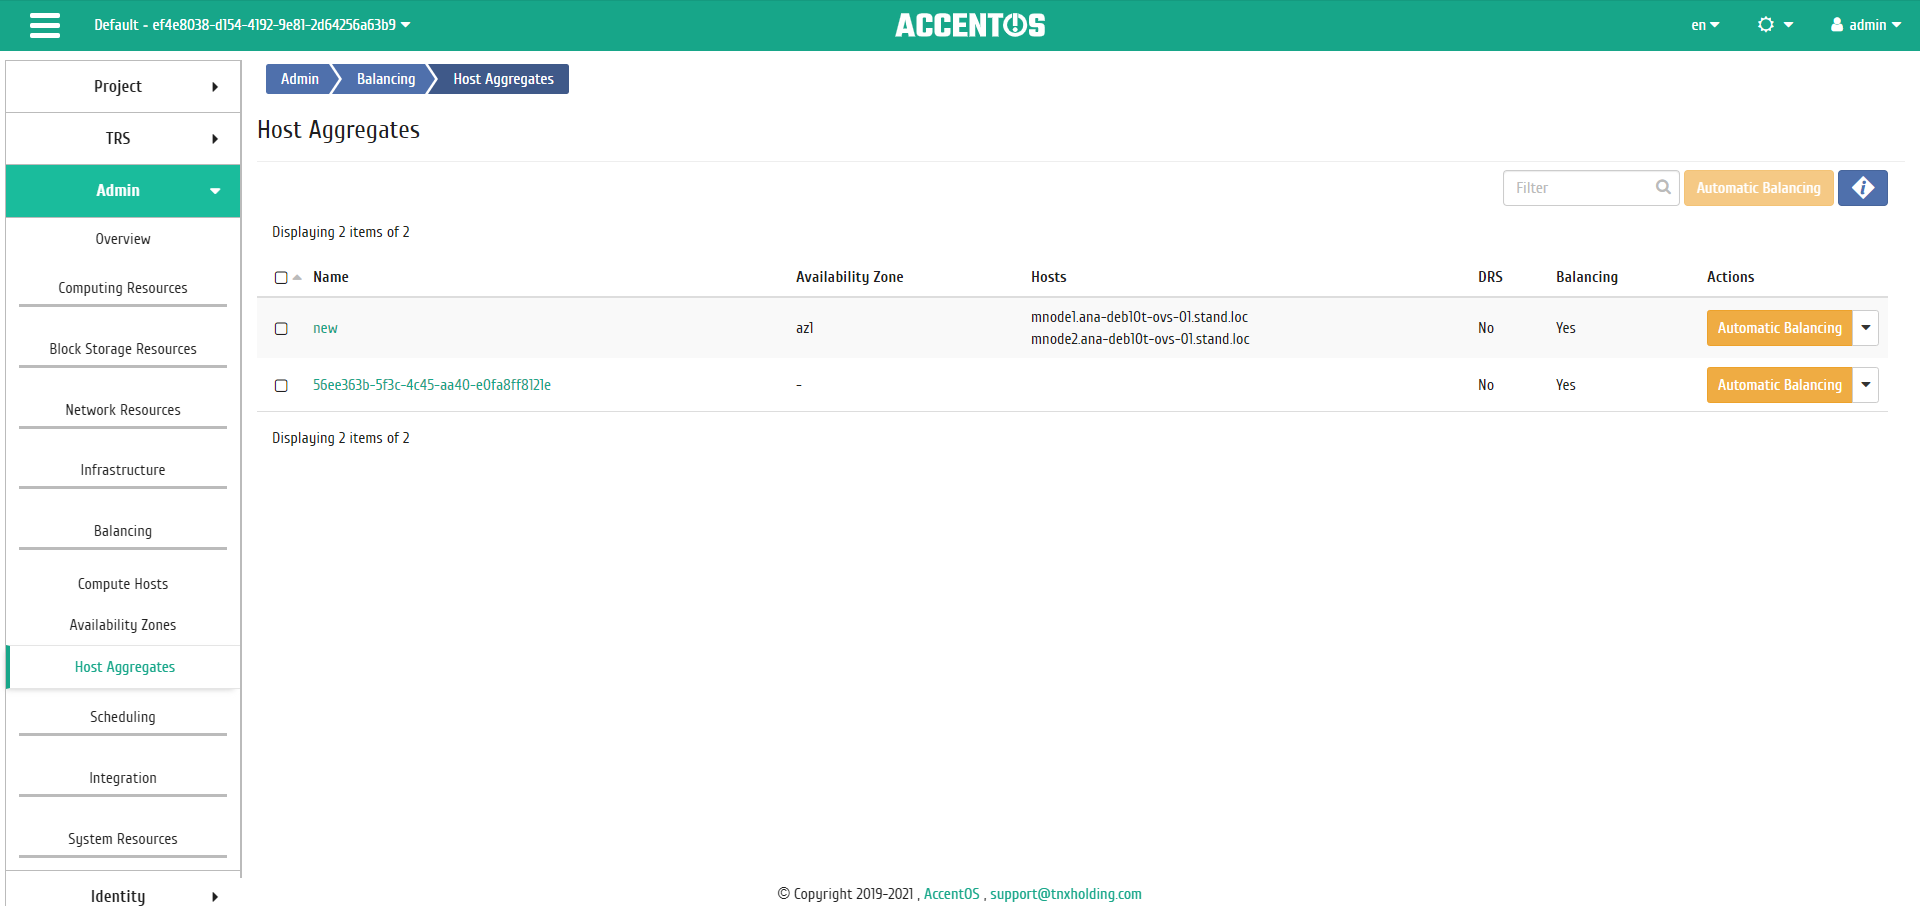
Host aggregates list
| Field name | Description |
|---|---|
| Name | Name of the host aggregate. It is also link to go to detailed information about the host aggregate. |
| Availability zone | Availability zone of aggregate. It is set at creation. |
| Hosts | List of hosts that are included in this aggregate. |
| DRS | Flag indicating that this host aggregate has metadata |
| Balancing | Flag indicating the ability to move instances from the host during balancing. Possible values are:
|
Sorting and filtering tools are available for the list of host aggregates. Fields are sorted in ascending and descending order.
Also, the user can view detailed information about the host aggregate. Detailed information about the object opens in a separate block on the right side of the page when you click on the host aggregate name link. This does not close the list of objects and is displayed on the left side of the page. To close block of detailed information use the  button, to open a block of detailed information use the button
  .
.
Detailed information about the host aggregate is presented in several internal tabs.
«Overview» tab
Tab displays detailed information about the selected host aggregate:
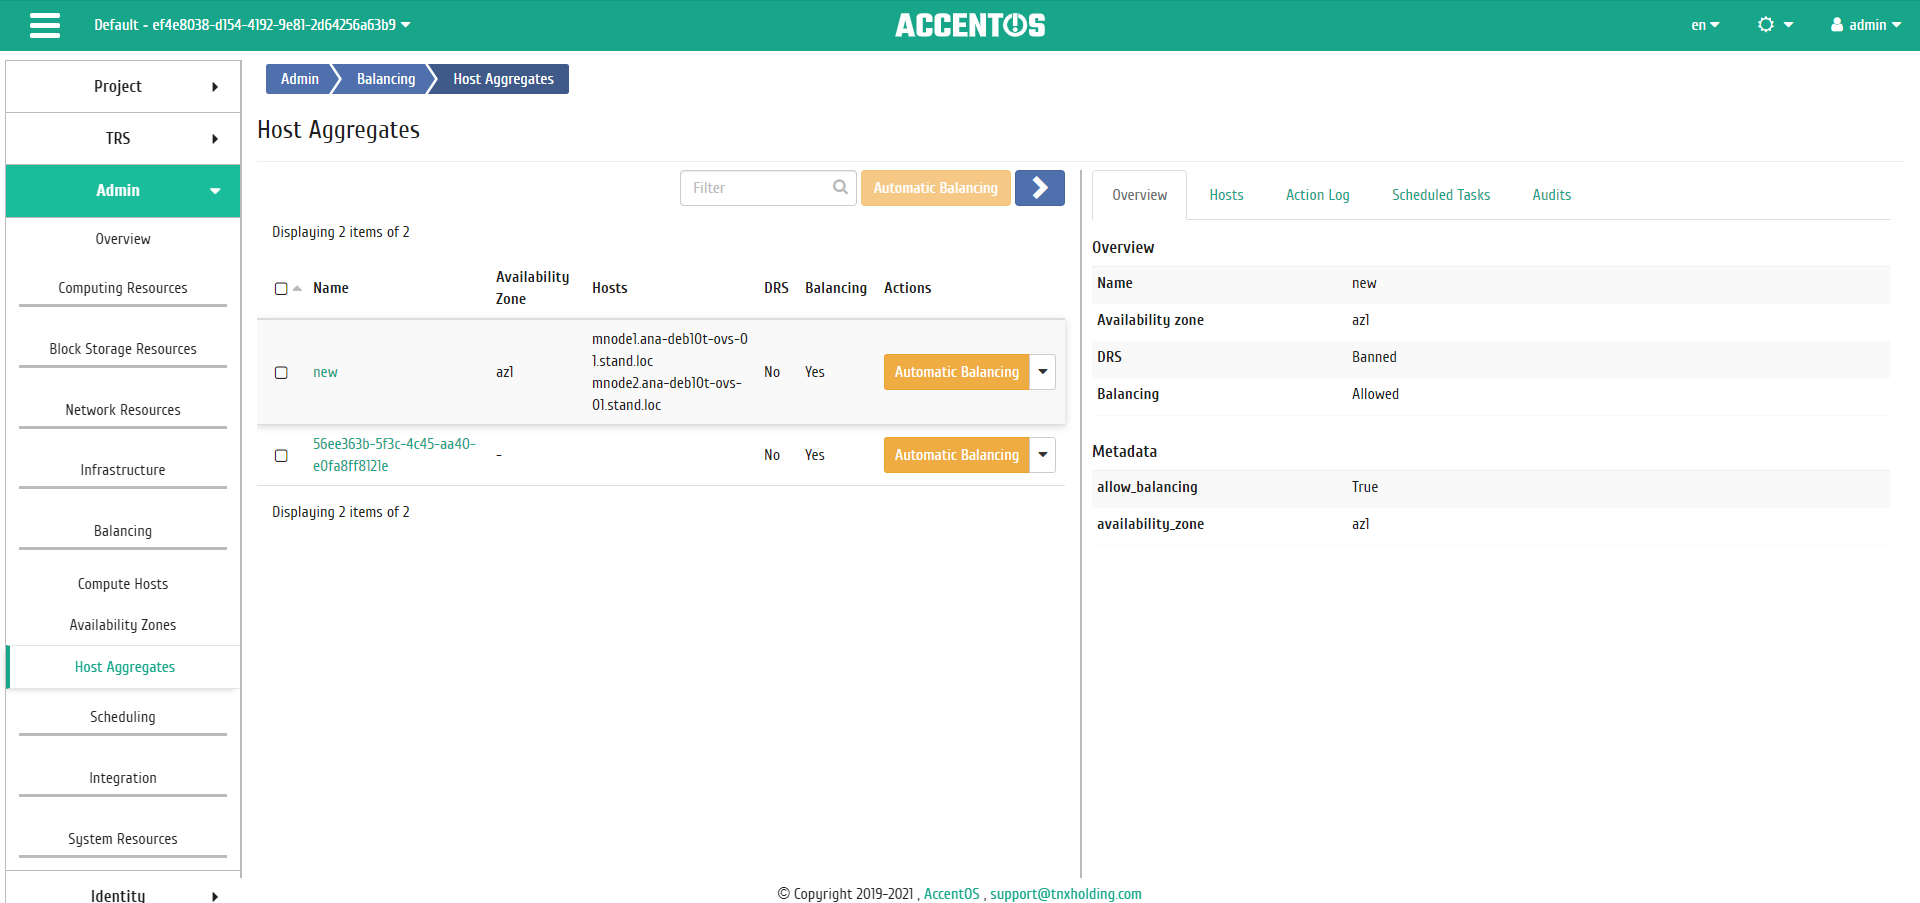
Detailed parameters of the host aggregate
«Action Log» tab
Tab displays information about the history of operations on the host aggregate:
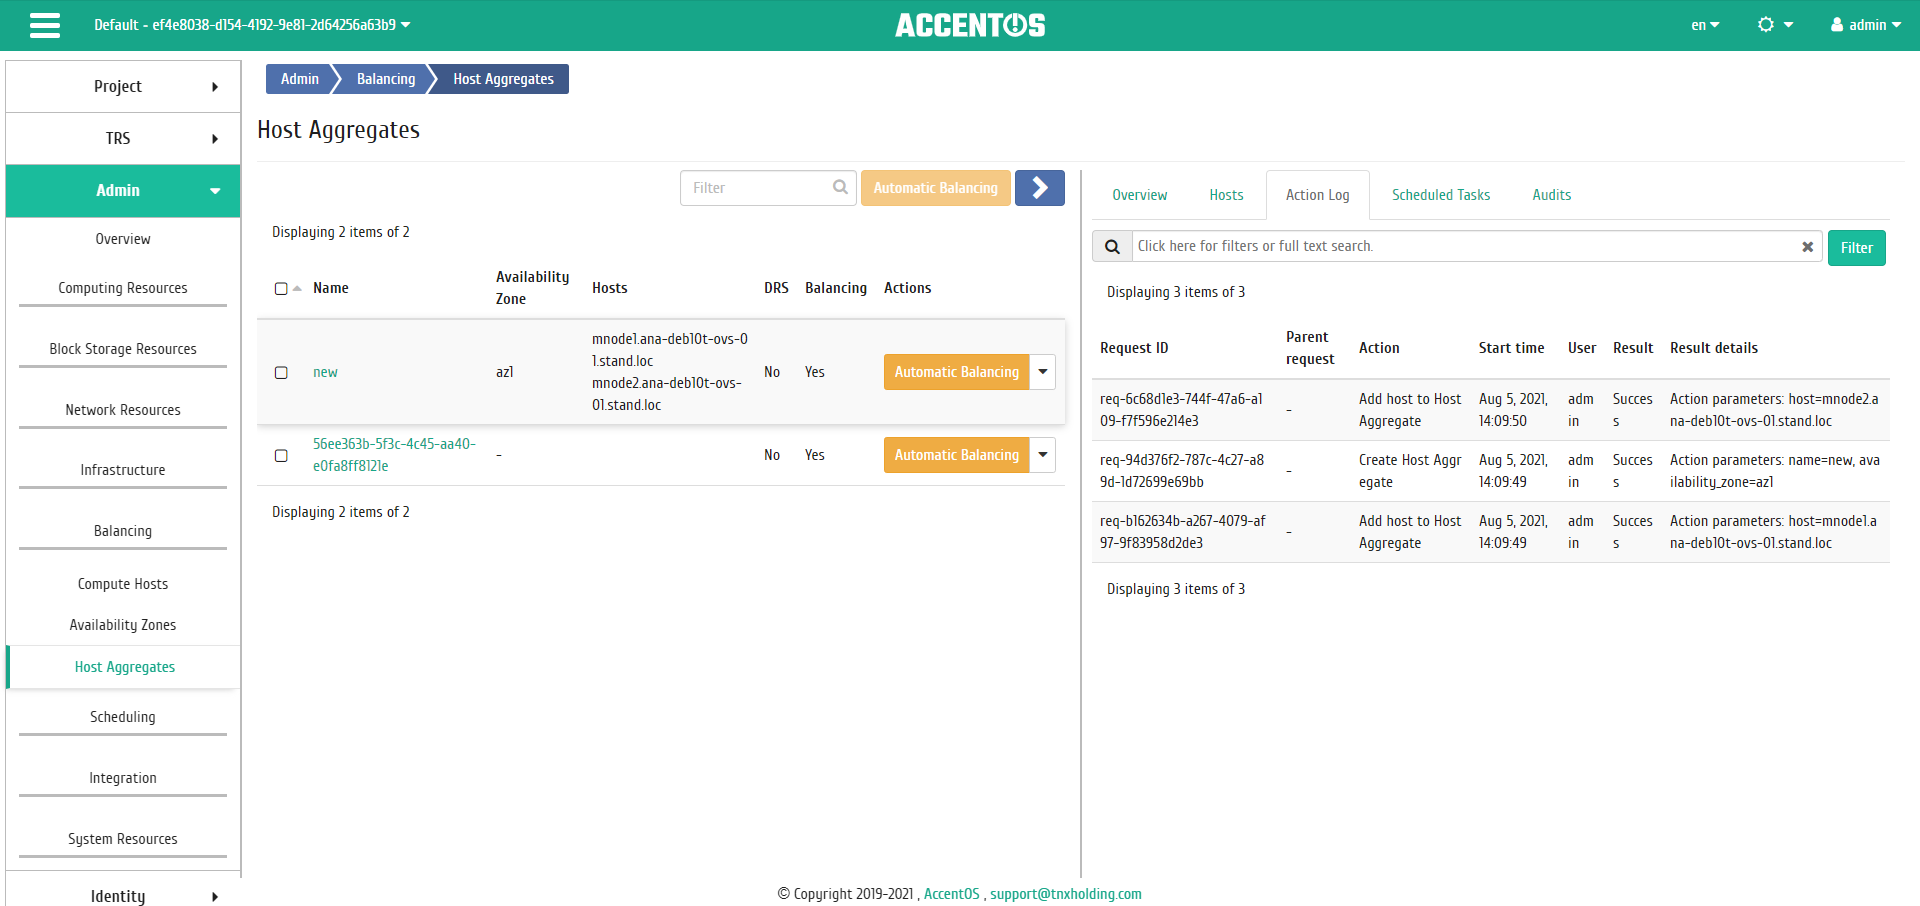
Action Log on host aggregate
«Scheduled Tasks» tab
Tab displays information about scheduled and completed tasks:
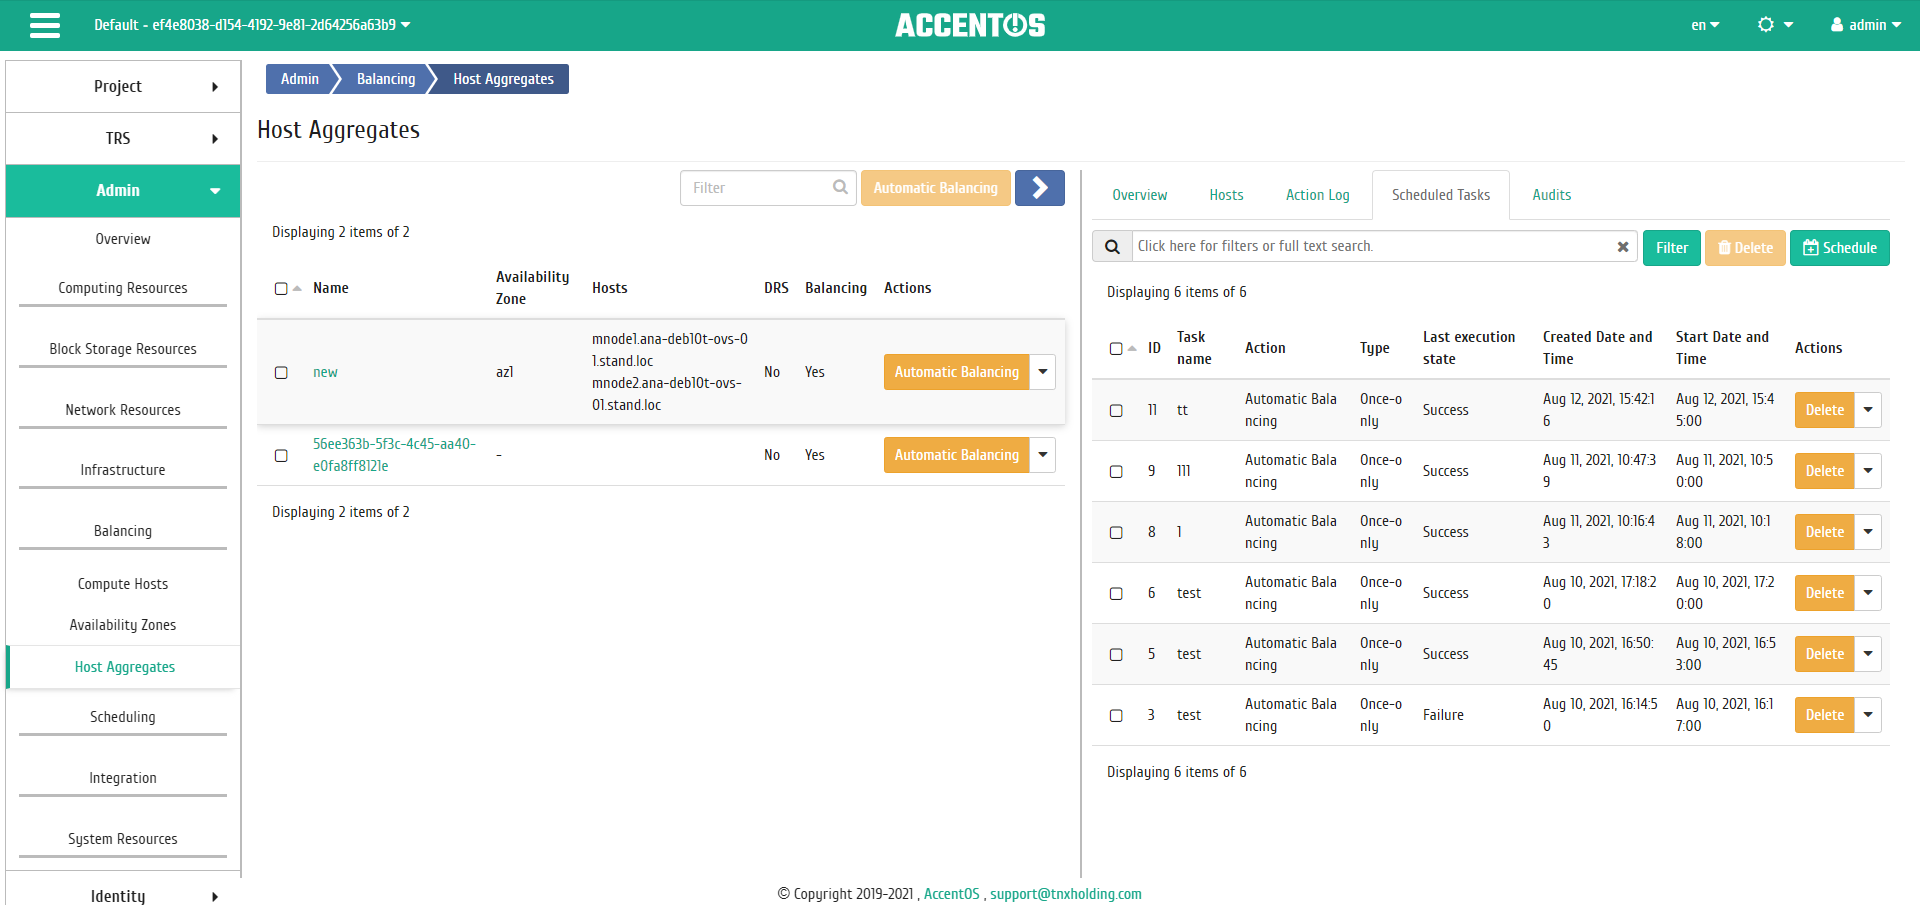
Scheduled tasks list
On the tab there is button “Schedule”, when you click on it, you go to the form for scheduling task on the object.
«Audits» tab
Tab lists audits of the host aggregate performed and applied:
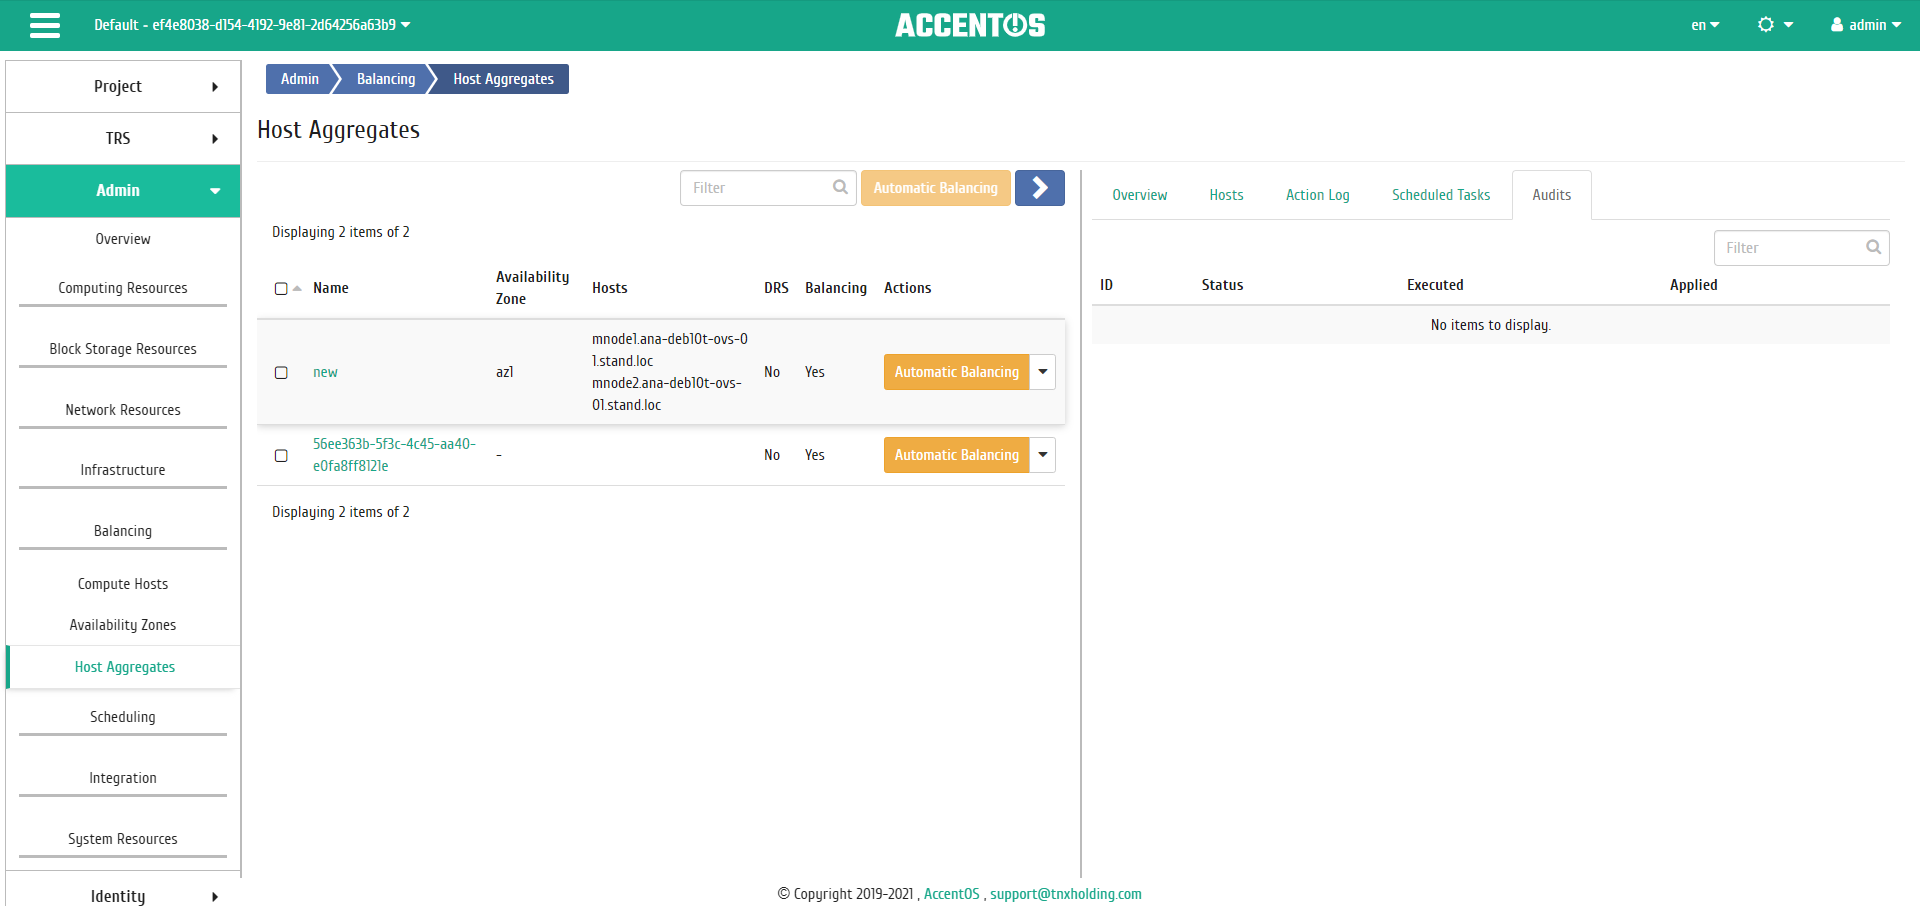
Audits list
| N | Action | Description |
|---|---|---|
| 1 | Schedule | Action scheduling. Working with queue of tasks and their frequency. Scheduling is only possible if there are available actions. |
| 2 | Execute Audit | It runs check to see if instances can be balanced on hosts within the selected host aggregate. Automatic applying of this action is also implemented in the action form «Apply Audit». Auditing is available only for aggregators that have metadata drs_enabled=True and drs_type=balancing/consolidation. |
| 3 | Apply Audit | Running instances balancing on hosts within the selected host aggregate. Last successful audit is running. Auditing is only available for aggregates that have metadata drs_enabled=True and drs_type=balancing/consolidation. |
| 4 | Automatic balancing | Launching automatic balancing of instances between hosts within the selected host aggregate(s) in order to optimize the use of RAM. Moving instances from one computing node to another is done by migration. |
Features of work
Executing audit
Note
Auditing is available only for aggregators that have metadata drs_enabled=True and drs_type=balancing/consolidation.
This function launchs check if the instances can be balanced across the hosts within the selected host aggregate. It is available in the general list of all aggregates. Select the required one and call the “Execute audit” action.
In the window that opens, check the correctness of the selection and, if necessary, set the automatic application of the audit after its completion. Start the audit by clicking “Execute”.
Note
List of audits executed is available in the internal tab of the Host aggregate details «Audits».
Applying audit
Note
Applying audit is available only for aggregators that have metadata drs_enabled=True and drs_type=balancing/consolidation.
Function allows to launch balancing instances on host within the selected host aggregate. Last successful audit is running. Automatic execution of this action is also implemented in the action form :ref:”Execute audit” <aos_balancing_host_aggregates_execute_audit>. It is available in the general list of all aggregates. Select the required one and call the “Apply audit” action:

Audit applying window
Launch the procedure with the confirmation button. Wait for the message that auditing was applied successfully. In case of an error, you will receive message indicating reason for the failure.
Automatic balancing
Important
Automatic balancing is performed only if the value is True of the parameter enabled of the section balancing of the CloudManager configuration file. Balancing is performed only for hosts located in the same Availability Zone.
Important
Action is available only for host aggregates that are not included in the nova availability zone, for which balancing is allowed: there is metadata allow_balancing =True.
Select one or more host aggregates belonging to the same Availability Zone and run an individual or group action “Automatic balancing”:

Automatic balancing confirmation window for host aggregates
Scheduling action
Select the required host aggregate and call the action:
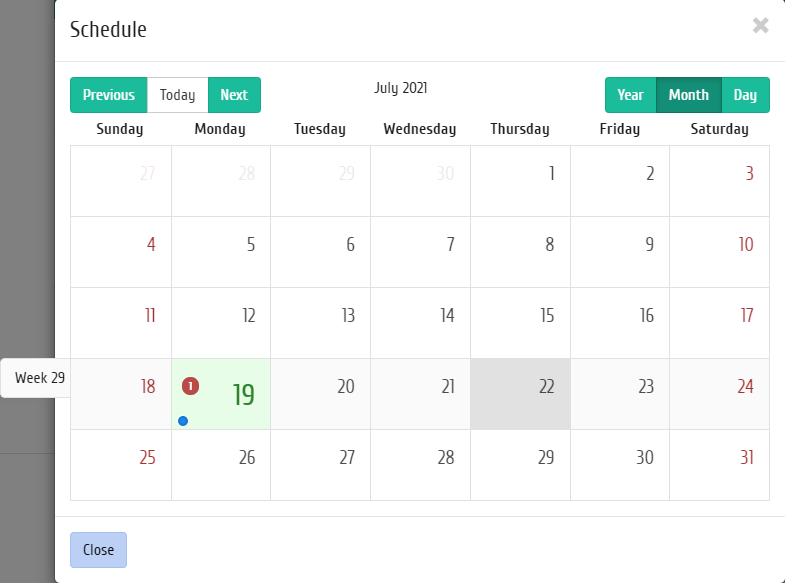
Scheduled action calendar
In the wizard window that opens, select the date. Highlighted days indicate the presence of planned actions on this object for the date, and blue marks indicate their number.
You can find out more about the list of tasks of the host aggregate in the drop-down list:
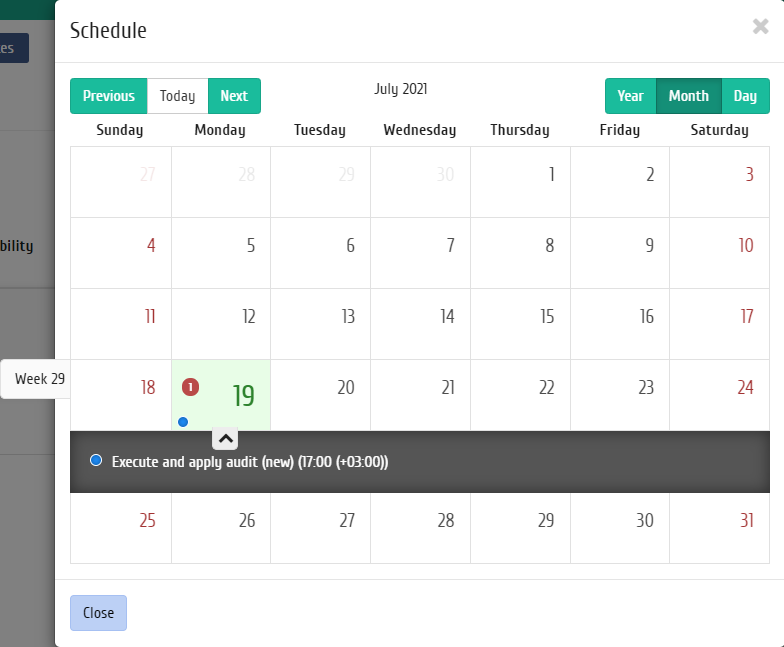
Scheduled action calendar
To go to the next step in the field of the selected date, click on an empty area or number. In the first case, you will be redirected to the task creation window. When you click on the number, you will be immediately prompted to select the duration:
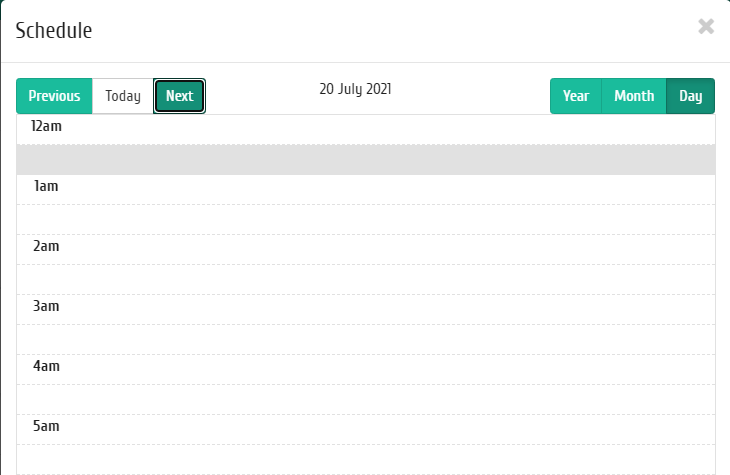
Scheduled action calendar
Specify the rest of the parameters of the scheduled action, which contain the internal tabs of the master window:
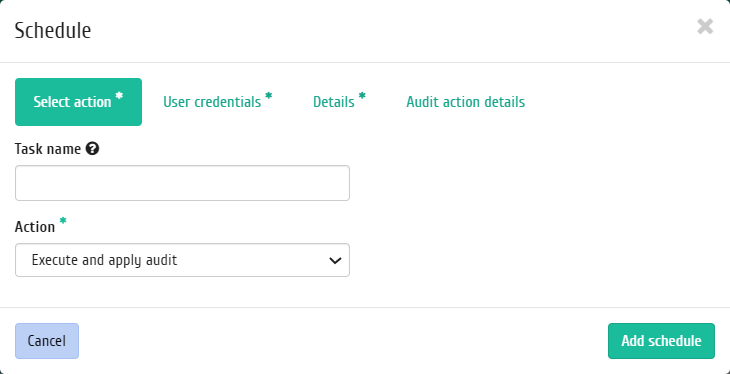
Task creating window
Let’s analyze their content in more detail:
Select an action:
- Task name is the name of the scheduled action; if empty, it will be generated automatically;
- Action is list of available actions on the instance:
- Run curl request is running HTTP request;
- Run openstack shell command is running console command using the utility
openstack; - Execute audit with automatic applying available only for aggregates that have metadata
drs_enabled=Trueanddrs_type=balancing/consolidation.
User credentials:
- Username is the login of the user planning the action;
- Password is password of the user planning the action;
- Project is working project of user planning the action.
Details:
- Type is the type of task. Following types are distinguished:
- Single task;
- Repeating task.
- Repeat, selection of values of the task execution interval. Following options are available:
- Days;
- Hours;
- Minutes;
- Working days (from Monday to Friday);
- Days of the week;
- Year.
- Repeat with interval, selection of task execution interval;
- Start date is the start date of the task in the format dd.mm.yyyy;
- Start time is the start time of the task in the format hh.mm;
- Time zone is the time zone according to which the task execution time is indicated;
- End is the conditions for terminating the task. Following conditions are distinguished:
- Never, when choosing a flag, the task becomes unlimited;
- Max number of repetitions is limiting the number of task executions;
- Date is the deadline for the task execution, set in the format dd.mm.yyyy.
Audit details:
- Apply audit after executing, when selecting flag, the audit will be applied after it has been executed. It is available only for aggregates that have metadata
drs_enabled=Trueanddrs_type=balancing/consolidation.
Curl request details:
- Address is host aggregate address;
- Request type is REST API request type. Following types exist:
- POST;
- GET;
- PUT;
- DELETE;
- PATCH.
Console command details:
- Command Arguments is OpenStack console command input field.
End the procedure with the confirmation button.
Note
To return to the page with the calendar and change the date, use the “Cancel” button.
Viewing detailed audit information
Function is available in the inner tab «Audits». Going is carried out by the link of the audit name.
Page that opens displays detailed information about the selected audit in the form of a structured tree-like list. Use «+»/«-» to expand or close list items.
